class: center, middle .title[Overview of Systems Modeling] <br> .subtitle[BEE 4750/5750] <br> .subtitle[Environmental Systems Analysis, Fall 2022] <hr> .author[Vivek Srikrishnan] <br> .date[August 24, 2022] --- name: toc class: left # Outline <hr> 1. Questions 2. Review of Last Class 3. Classification of Systems Models 4. Example --- name: poll-answer layout: true class: left # Poll <hr> .left-column[{{content}} URL: [https://pollev.com/vsrikrish](https://pollev.com/vsrikrish) Text: **VSRIKRISH** to 22333, then message] .right-column[.center[]] --- name: questions template: poll-answer ***Any questions?*** --- layout: false class: left # Last Class <hr> * Class Structure and Policies * What Is A System? --- class: left # What Is A System? <hr> .left-column[A system consists of a set of components which are connected by pathways over which flows affect stocks. **What are some examples?**] .right-column[] --- class: left # What Is *Not* a System? <hr> We don't need a systems approach when components can be treated individually, e.g., *the whole is no more than the sum of its parts*. **Can we think of some examples?** --- class: left # Systems Analysis Needs <hr> To model a system, we need: * A **definition** of the system ✅ * A **model** of the system --- class: left # What Is A Model? <hr> .left-column[### Physical Models .centered[] .centered[.cite[Source: [Wikimedia](https://commons.wikimedia.org/wiki/File:Fallingwater_miniature_model_at_MRRV,_Carnegie_Science_Center.JPG>)]]] ] .right-column[### Mathematical Models .centered[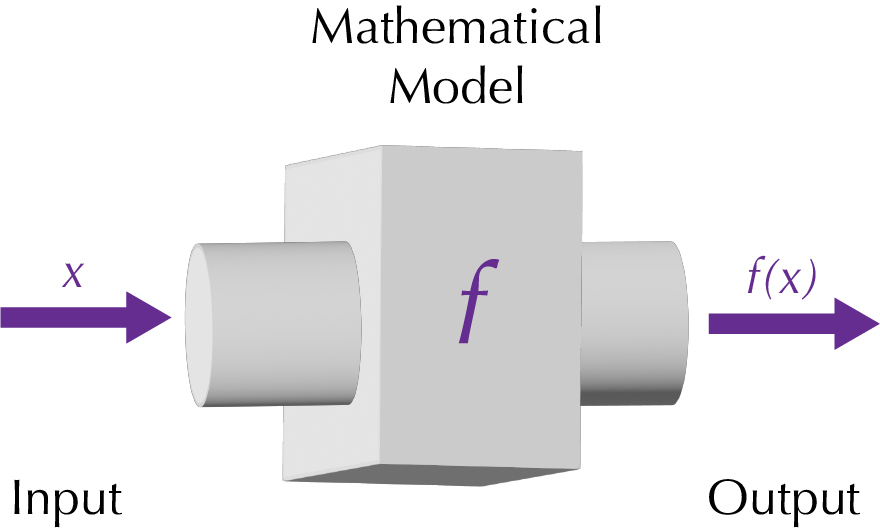] ] --- class: left # Mathematical Models of Systems <hr> .center[] --- class: left # Environmental Systems Example <hr> .left-column[.middle[]] .right-column[ Examples: * Municipal sewage into lakes, rivers, etc. * Power plant emissions into air * Solid waste placed on landfill * CO<sub>2</sub> into atmosphere ] --- class: left # Types of Mathematical Models <hr> .left-column[## Deterministic Models .centered[] ] .right-column[## Stochastic Models .centered[] ] --- class: left # Types of Mathematical Models <hr> .left-column[## Descriptive Models Used primarily for describing or simulating dynamics. * Intended for *simulations* and *exploratory* and/or *Monte Carlo analysis*. ] .right-column[## Prescriptive Models Specify (prescribe) an action, decision, or policy. * Intended for *optimization* or *decision analysis*. ] --- class: left name: crud-example layout: true # An Example! <hr> .center[] {{content}} --- Two factories are discharging a chemical, *chlororadiated ureadicarboxyl* (CRUD), into the Riley River. --- Environmental authorities have sampled water from the river and determined that concentrations exceed the legal standard (1 mg/L). --- We want to design a CRUD removal plan to get back in compliance. **Where do we start? What do we need to know?** --- class: left layout: false # What We Know About CRUD <hr> * CRUD decays in the river with first-order decay coefficient $k=0.45 \ \text{d}^{-1}$. -- * Treating CRUD costs $ \$50 E^2 \text{ per } 1000 \ m^3,$ where $E$ is the treatment efficiency. * If $E_i$ is the treatment efficiency at factory $i$, the total treatment cost is $$ C(E_1, E_2) = 50(100)E_1^2 + 50(60)E_2^2. $$ --- class: left layout: true # How Much To Remove? <hr> Consider the problem at each point of release. .center[] {{content}} --- (recall that $1 \ \text{mg/L} = 1 \ \text{g/m}^3 = 10^{-3} \ \text{kg/m}^3$) --- 1. What is the inflow? What is the outflow for a given $E_i$? 2. How does this impact the concentration downstream? --- class: left layout: false # Mass Balance at Release 1 <hr> .center[] -- Factory 1 releases $100 \ \text{kg/d}$ without treatment. **What is the outflow for a given $E_1$?** --- class: left # Mass Balance at Release 1 <hr> .center[] -- Total CRUD after factory 1 release: $\color{blue}\text{100} + \color{red} 1000(1-E_1) \color{black} \ \text{kg/d}$ --- class: left # Mass Balance at Release 2 <hr> .center[] -- But this isn't the inflow for release 2... --- class: left # Mass Decay <hr> Given a decay rate of $k = 0.45 \ \text{d}^{-1}$: $$ \frac{dM}{dt} = -0.45 M \Rightarrow \frac{dM}{M} = -0.45 dt $$ $$ \int_{M(0)}^{M(T)} \frac{dM}{M} = -0.45 \int_0^T dt $$ $$ \ln\left(\frac{M(T)}{M(0)}\right) = -0.45 T $$ $$ M(T) = M(0) \exp\left(-0.45 T\right) $$ --- class: left # Mass Decay <hr> So now we know that after $t$ days, $M(t) = M_0 \exp \left(-0.45 T \right).$ -- But we want to know $M(x)$, where $x$ is in distance, since we know the distance between factories 1 and 2 is $10 \ \text{km}$. --- class: left # Mass Decay <hr> Since the velocity of the river is $25 \ \text{km/d}$: $$ M(x) = M_0 \exp\left(-0.45 (x/25)\right), \quad x \leq 10 \ \text{km}, $$ and simplifying and plugging in $x = 10$ and $M_0$, the inflow of CRUD at the factory 2 release is: $$ M(10) = (1100 - 1000E_1) \exp(-0.18) \ \text{kg/d}. $$ --- class: left # Mass Balance at Release 2 <hr> .center[] --- class: left # Mass Balance at Release 2 <hr> .center[] This means that after factory 2 releases CRUD, the concentration is: $$ (1100 - 1000E_1) \exp(-0.18) + 1200(1 - E_2) \ \text{kg/d}. $$ --- class: left # Mass Balance at Release 2 <hr> .center[] We can use this as an initial condition for $M(x), x > 10$: $$ M(x) = M_1 \exp\left(-0.45 (x/25)\right), \quad x > 10, $$ where $M_1 = (1100 - 1000E_1) \exp(-0.18) + 1200(1 - E_2)$. --- class: left # ...Now What? <hr> Our next steps depend on what we're trying to do: is our model descriptive or prescriptive? -- * *Descriptive*: Use the dynamical equations to simulate concentrations for varying levels of $E_1, E_2$ and compare those to the costs and the legal limit. -- * *Prescriptive*: Turn these equations and limits into constraints and find the values of $E_1, E_2$ which minimize costs while staying in compliance (we'll return to this later!). --- class: left # Discussion of Oreskes et al (1994) <hr> > Models can corroborate a hypothesis by offering evidence to strengthen what may be already partly established through othermeans. Models can elucidate discrepancies in other models. Models can be also be used for sensitivity analysis –- for exploring "what if" questions –- thereby illuminating which aspects of the system are most in need of further study, and where more empirical data are most needed. **Thus, the primary value of models is heuristic: Models are representations, useful for guiding further study but not susceptible to proof.** > > .cite[– Oreskes et al, 1994] --- class: left # "All Models Are Wrong, But Some Are Useful" <hr> > ...all models are approximations. Essentially, all models are wrong, but some are useful. However, the approximate nature of the model must always be borne in mind.... > > .cite[– Box & Draper, 1987] -- A key consideration: how do we check/ensure that models we use are useful? How do we know when they're not? --- class: left # A Leading Question <hr> Someone has developed a model of a complex process (say...number of cases of a particular infectious disease). They claim that their model has precisely predicted case counts for a few months, and use this to argue for the model's validity (and their skill as a modeler, presumably). -- **Should we trust their claim? What might this imply about the model? Is it useful?** --- class: middle, left <hr> # Next Class <hr> * Descriptive modeling with systems simulation * What are *uncertainty* and *risk* and why are they important concepts?